Reader Survey 2025
Reader Survey 2025: Initial results and quick wins
Summary
The responses to the Bodleian Libraries Reader Survey 2025 show that, overall, reader satisfaction with our services and provision has increased, reaching the highest-ever level on all three measures. Satisfaction levels continue to differ between readers at different levels (undergraduate, postgraduate, academic staff, external readers). Postgraduates are least satisfied in all aspects, and academics are more satisfied than students in all aspects.
Collections are the highest priority for all University members: this has the highest ideal level of provision. It is also the area where we perform worst for all three groups, as our current level is furthest away from that ideal level. Students consider physical library space to be the next highest priority, followed by library staff customer service. This order is reversed for academic staff. Despite lower scores than 2022, library staff customer service is still the best-performing aspect of our provision across all three groups (closest to the ideal level).
We have analysed all of the 1011 free-text comments to identify specific areas for immediate attention. We aim to be able to make changes and ‘close the loop’ by communicating these changes before the end of the academic year.
Further to the summary results below, we will now undertake more detailed analysis of the quantitative data by subject studied, most frequently used library and college attended. We will also analyse by gender, ethnicity group, disability group, first-generation status, and mode of study. We will comprehensively analyse the free-text comments for actions, trends and insights.
Background
The Bodleian Libraries Reader Survey 2025 ran from 27 January – 24 February. It used a standardised survey instrument (ARL’s LibQUAL+) but was constructed using the Qualtrics tool so that we could ask additional demographic questions. This enabled us to compare our results to our previous results, and also to other comparative institutions, including Cambridge.
The survey asked questions in five standard areas: collections, libraries staff, physical library spaces, overall satisfaction and information literacy. It also asked demographic and usage questions. In addition, we asked a set of questions related to the Bodleian Libraries Strategy. These were specific to our survey, athough some were repeated from previous years to measure impact.
In common with traditional surveys, our overall satisfaction questions asked for a simple satisfaction score on a scale of 1 to 9. The other questions asked respondents to indicate on a scale of 1 to 9 the lowest level they would find acceptable, the level they ideally want, and the level they feel the libraries currently provide. This allows us to determine the relative importance of different aspects of the libraries’ provision and service, and discover our readers' expectations in these areas.
Response rate
We received 4,954 responses, of which 4,655 had sufficient answers to enable statistical analysis. This is 3% lower than the 4,823 analysable responses in 2022.
The response level from current students was 13% lower than when the survey was run in 2022. This might be due to the National Student Survey running at the same time this year, whereas in 2022 it was boycotted by Oxford students. Eighteen percent of undergraduates (2,249) and 12% of postgraduates (1,689) completed the survey. These are both statistically significant sample sizes (confidence level = 99%; margin of error = 3%).
Forty-five percent (755) of postgraduate responses were from taught students; 55% (934) from research students. There were also responses from 170 other students (mostly visiting students). 230 responses were from academic staff and 107 from College and administrative staff. 176 were from Bodleian Reader card holders (i.e. not current members of the University).
Overall satisfaction levels
Our scores in the three satisfaction questions are the highest levels ever, as shown in the table below (Table 1).
| 2012 | 2016 | 2019 | 2022 | 2025 | |
|---|---|---|---|---|---|
| In general, I am satisfied with the way in which I am treated by the libraries | 7.64 | 7.69 | 7.84 | 7.79 | 7.96 |
| In general, I am satisfied with the libraries' support for my learning, research and/or teaching needs | 7.32 | 7.36 | 7.47 | 7.40 | 7.72 |
| How would you rate the overall quality of the service provided by the libraries? | 7.47 | 7.57 | 7.71 | 7.62 | 7.76 |
After a dip in 2022, the overall quality score is now the highest level it has been, as illustrated in the below graph (Figure 1).
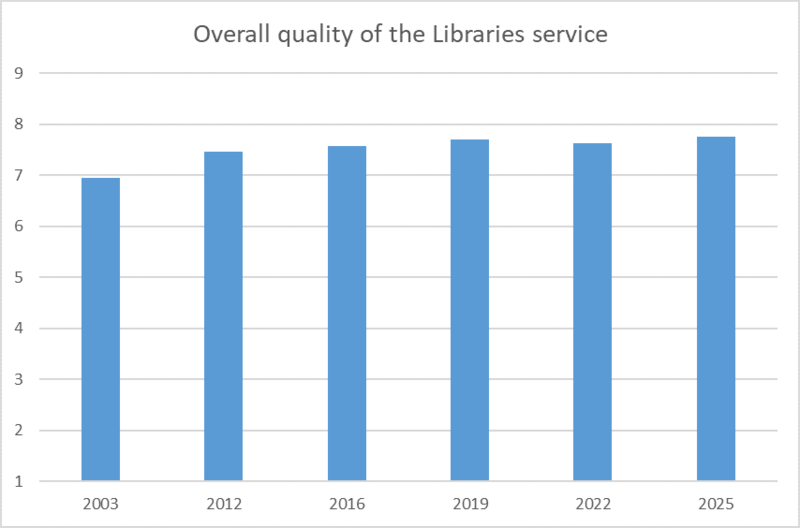
Figure 1: Overall quality of the Libraries service
Academic staff (n=205) are more satisfied than students in all three measures of satisfaction. Undergraduates (n=1,894) are more satisfied than postgraduates (n=1,529) in all three aspects.
External readers (n=139) are more satisfied than Oxford University members with support and quality.
| Undergraduate | Postgraduate | Academic staff | External | |
|---|---|---|---|---|
| In general, I am satisfied with the way in which I am treated by the libraries | 8.00 | 7.89 | 8.04 | 8.00 |
| In general, I am satisfied with the libraries' support for my learning, research and/or teaching needs | 7.75 | 7.64 | 7.78 | 7.95 |
| How would you rate the overall quality of the service provided by the libraries? | 7.77 | 7.67 | 7.86 | 8.13 |

Figure 2: 2025 satisfaction results
Reader expectations and priorities
Taking the answers of all respondents, the overall 2025 results are similar to the 2022 results. The level of libraries staff customer service respondents feel is currently provided has continued to decrease (now lower than 2016 level). The level respondents feel is currently provided in terms of collections has increased slightly, and there has been a large increase for physical library space.
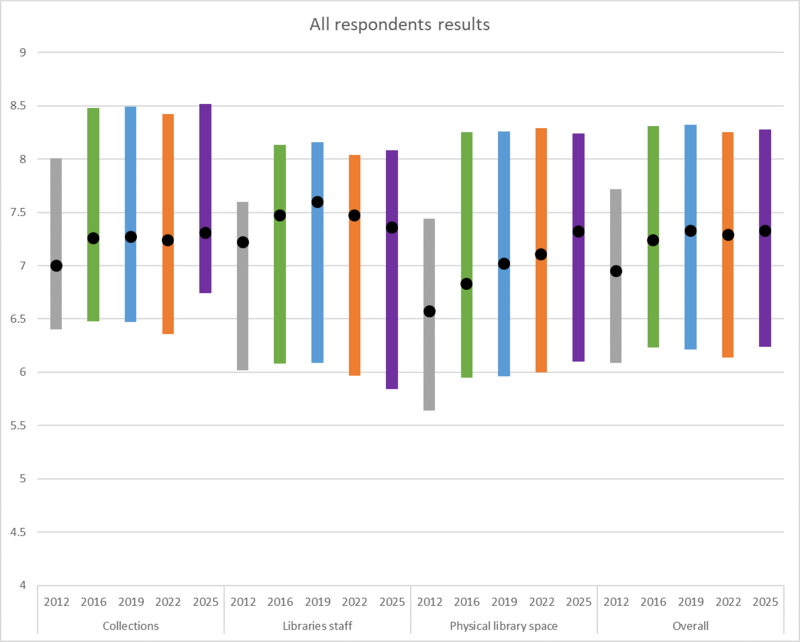
Figure 3: All respondents' results
| Year | The lowest level I find acceptable is... | The level I ideally want is... | I feel the level currently is... | |
|---|---|---|---|---|
| Collections | 2012 | 6.40 | 8.01 | 7.00 |
| 2016 | 6.48 | 8.48 | 7.26 | |
| 2019 | 6.47 | 8.49 | 7.27 | |
| 2022 | 6.36 | 8.42 | 7.24 | |
| 2015 | 6.74 | 8.52 | 7.31 | |
| Libraries staff | 2012 | 6.02 | 7.60 | 7.22 |
| 2016 | 6.08 | 8.13 | 7.60 | |
| 2019 | 6.09 | 8.16 | 7.60 | |
| 2022 | 5.97 | 8.04 | 7.47 | |
| 2025 | 5.84 | 8.08 | 7.36 | |
| Physical library space | 2012 | 5.64 | 7.44 | 6.57 |
| 2016 | 5.95 | 8.25 | 6.83 | |
| 2019 | 5.96 | 8.26 | 7.02 | |
| 2022 | 6.00 | 8.29 | 7.11 | |
| 2025 | 6.10 | 8.24 | 7.32 | |
| Overall | 2012 | 6.09 | 7.72 | 6.95 |
| 2016 | 6.23 | 8.31 | 7.24 | |
| 2019 | 6.21 | 8.32 | 7.33 | |
| 2022 | 6.14 | 8.25 | 7.29 | |
| 2025 | 6.24 | 8.28 | 7.33 |
From the 2025 results, collections remain the most important aspect of library services for all three University of Oxford groups. For undergraduates and postgraduates, this continues to be followed by physical library spaces, with libraries staff customer service third. For academics, libraries staff customer service is once again slightly more important than physical library spaces.
Perception of our current performance level for physical library space and collection provision & access is consistent across all three groups. Undergraduates report a lower level of performance of libraries staff customer service than postgraduates, who report lower performance than academic staff.
The ‘zone of tolerance’ – the difference between the ideal and lowest acceptable levels of provision (the coloured bars in the above graph) – varies a small amount across the three groups. Undergraduates have the largest and academic staff the smallest in all three areas.
Despite the lower scores than 2022, library staff customer service is still the best-performing aspect of our provision for all three groups (we are closest to the ideal level – towards the top of the ‘zone of tolerance’). Collections is our worst-performing for all three groups. This is a change from 2022, when it was physical library space for academic staff.

Figure 4: 2025 results
| Dimension | The lowest level I find acceptable is... | The level I ideally want is... | I feel the level currently is... | |
|---|---|---|---|---|
| Undergraduates | Collections | 6.55 | 8.49 | 7.25 |
| Libraries staff | 5.53 | 7.95 | 7.21 | |
| Physical library space | 5.91 | 8.21 | 7.36 | |
| Postgraduates | Collections | 6.89 | 8.57 | 7.37 |
| Libraries staff | 6.04 | 8.21 | 7.47 | |
| Physical library space | 6.25 | 8.31 | 7.27 | |
| Academic staff | Collections | 7.11 | 8.54 | 7.41 |
| Libraries staff | 6.47 | 8.30 | 7.65 | |
| Physical library space | 6.48 | 8.21 | 7.21 |
Collections
We had eight questions about collections and access to them, of which each respondent was asked three. Everyone was asked, “The electronic resources (e.g. e-journals, e-books, databases) I need” and the other two questions were randomly selected from the pool. This year, the question “Print and/or electronic journals I require for my work” was removed as it is now too similar to the other questions. ‘Diversity of materials reflecting the full range of scholarship in my subject’ was added, following insight from the We Are Our History research.
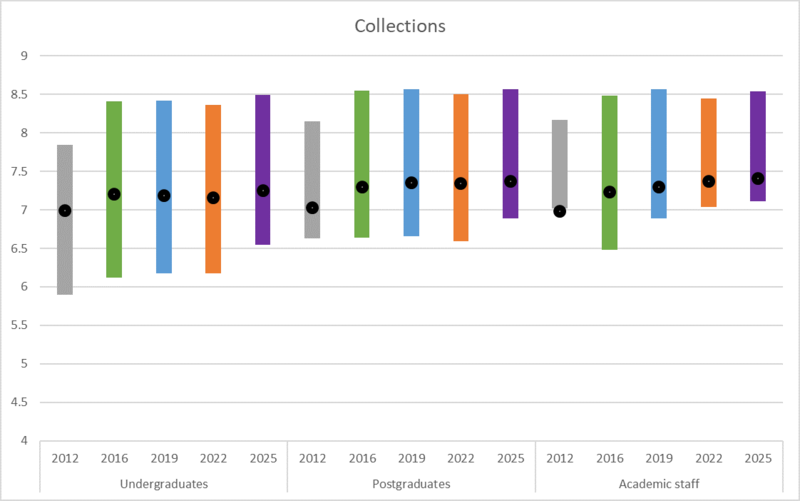
Figure 5: Collections
| Year | The lowest level I find acceptable... | The level I ideally want is... | I feel the level currently is... | |
|---|---|---|---|---|
| Undergraduates | 2012 | 5.90 | 7.84 | 6.99 |
| 2016 | 6.12 | 8.41 | 7.20 | |
| 2019 | 6.18 | 8.42 | 7.19 | |
| 2022 | 6.18 | 8.36 | 7.16 | |
| 2025 | 6.55 | 8.49 | 7.25 | |
| Postgraduates | 2012 | 6.63 | 8.15 | 7.03 |
| 2016 | 6.64 | 8.55 | 7.30 | |
| 2019 | 6.66 | 8.57 | 7.35 | |
| 2022 | 6.59 | 8.50 | 7.34 | |
| 2025 | 6.89 | 8.57 | 7.37 | |
| Academic staff | 2012 | 7.02 | 8.17 | 6.98 |
| 2016 | 6.48 | 8.48 | 8.48 | |
| 2019 | 6.89 | 8.57 | 7.30 | |
| 2022 | 7.04 | 8.45 | 7.37 | |
| 2025 | 7.11 | 8.54 | 7.41 |
Our current performance scores have broadly plateaued since the 2016 survey, with undergraduates giving the lowest score (7.25), followed by postgraduates (7.37) then academic staff (7.41). The ideal scores have increased across all three groups, and are now the highest ever for undergraduates (8.49), though still higher for postgraduates (8.57) and academic staff (8.54). The lowest level has risen a large amount for undergraduates (6.55) and postgraduates (6.89) and slightly for academic staff (7.11).
Libraries staff
We had nine questions about libraries staff, of which each respondent was asked three. Everyone was asked “Staff who deal with readers in a caring manner” and the other two questions were randomly selected from the pool.
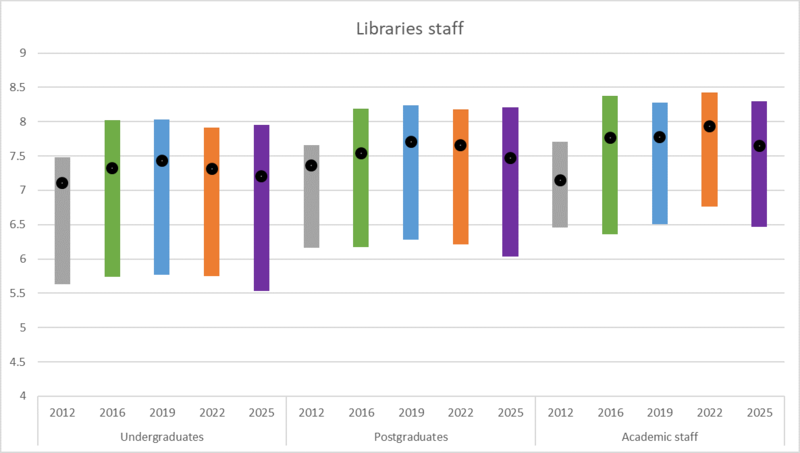
Figure 6: Libraries staff
| Year | The lowest level I find acceptable... | The level I ideally want is... | I feel the level currently is... | |
|---|---|---|---|---|
| Undergraduates | 2012 | 5.63 | 7.48 | 7.11 |
| 2016 | 5.74 | 8.02 | 7.32 | |
| 2019 | 5.77 | 8.03 | 7.43 | |
| 2022 | 5.75 | 7.91 | 7.31 | |
| 2025 | 5.53 | 7.95 | 7.21 | |
| Postgraduates | 2012 | 6.16 | 7.66 | 7.36 |
| 2016 | 6.17 | 8.19 | 7.54 | |
| 2019 | 6.28 | 8.24 | 7.71 | |
| 2022 | 6.21 | 8.24 | 7.71 | |
| 2025 | 6.04 | 8.21 | 7.47 | |
| Academic staff | 2012 | 6.46 | 7.71 | 7.15 |
| 2016 | 6.36 | 8.38 | 7.77 | |
| 2019 | 6.51 | 8.28 | 7.78 | |
| 2022 | 6.76 | 8.43 | 7.93 | |
| 2025 | 6.47 | 8.30 | 7.65 |
Our current performance level continues to decrease from the 2019 survey for undergraduates (7.4 to 7.2). The increases of the last 2 surveys for postgraduates (7.7 to 7.5) have reversed and it is now below the 2016 level, as is the current performance level for academic staff (7.7). The lowest level all three groups would find acceptable has decreased to 5.5 for undergraduates, 6.0 for postgraduates, and 6.5 for academic staff. Ideal scores have risen slightly for undergraduates and postgraduates, and decreased for academic staff.
Physical library use
The libraries used most often by respondents are their college library (29.4%), followed by Old Bodleian Library (14.7%), Radcliffe Camera and Gladstone Link (14.5%), Radcliffe Science Library (8.3%); Taylor Institution Library (4.2%) and Social Science Library (4.2%). 128 respondents (3.0%) stated that they do not use a physical library.
We had five questions about physical library spaces, of which each respondent was asked two. Everyone was asked, “Library space that inspires study and learning” and the other question was randomly selected from the pool. We asked respondents to answer in respect of the library they used most often. Those who do not use a physical library were not asked any questions about physical library spaces (unlike in 2012 where they had to answer, and other previous years where they could answer ‘N/A’).
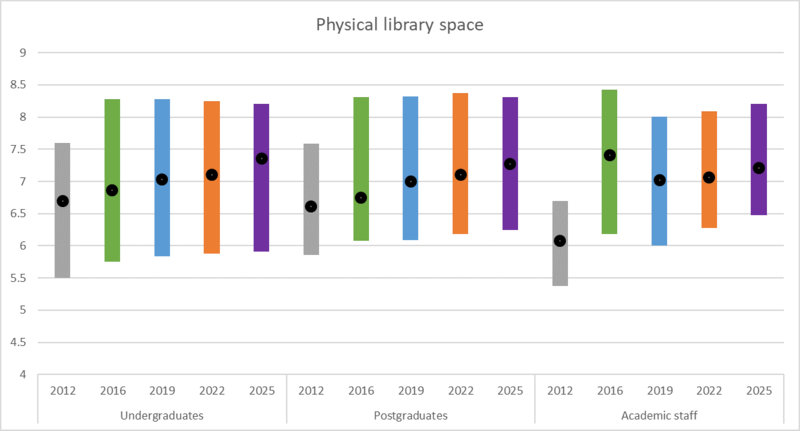
Figure 7: Physical library space
| Year | The lowest level I find acceptable is... | The level I ideally want is... | I feel the level currently is... | |
|---|---|---|---|---|
| Undergraduates | 2012 | 5.50 | 7.60 | 6.70 |
| 2016 | 5.75 | 8.28 | 6.86 | |
| 2019 | 5.84 | 8.28 | 7.03 | |
| 2022 | 5.88 | 8.25 | 7.11 | |
| 2025 | 5.91 | 8.21 | 7.36 | |
| Postgraduates | 2012 | 5.86 | 7.59 | 6.61 |
| 2016 | 6.08 | 8.31 | 6.75 | |
| 2019 | 6.09 | 8.32 | 7.00 | |
| 2022 | 6.18 | 8.37 | 7.10 | |
| 2025 | 6.25 | 8.31 | 7.27 | |
| Academic staff | 2012 | 5.38 | 6.70 | 6.08 |
| 2016 | 6.18 | 8.43 | 7.41 | |
| 2019 | 6.00 | 8.01 | 7.02 | |
| 2022 | 6.28 | 8.09 | 7.06 | |
| 2025 | 6.48 | 8.21 | 7.21 |
All three groups have increased their assessment about how well we meet their needs for physical library spaces, and now show variation between the groups. Undergraduates rate this highest (7.36), followed by postgraduates (7.27) and academic staff (7.21). For both undergraduates and postgraduates, the lowest acceptable level has slightly risen and the ideal level slightly decreased; both have risen for academic staff.
Information skills
The questions about information skills were completely changed in terms of presentation in the 2025 survey.
In the 2012, 2016, 2019, and 2022 surveys, we asked only a single ‘Perception of current level’, and all respondents were presented with two questions at random.
For reference, below is the graph for scores from Oxford University students (Figure 8).
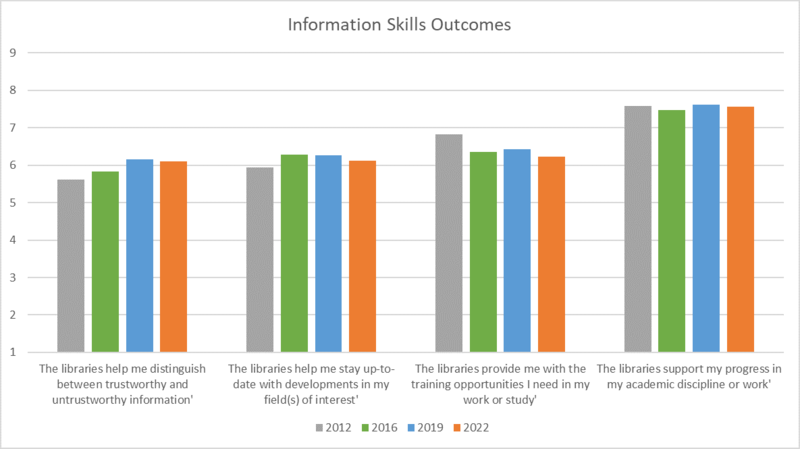
Figure 8: Information skills outcomes
| 2012 | 2016 | 2019 | 2022 | |
|---|---|---|---|---|
| 'The libraries help me distinguish between trustworthy and untrustworthy information' | 5.61 | 5.83 | 6.16 | 6.10 |
| 'The libraries help me stay up-to-date with developments in my field(s) of interest' | 5.94 | 6.29 | 6.26 | 6.12 |
| 'The libraries provide me with the training opportunities I need in my work or study' | 6.82 | 6.36 | 6.43 | 6.23 |
| 'The libraries support my progress in my academic discipline or work' | 7.58 | 7.48 | 7.61 | 7.57 |
In the 2025 survey, the same ‘triple’ of lowest acceptable level, ideal level and current level were presented. Information Skills questions were only presented to University of Oxford students and academic staff. All were asked the question, “The libraries support my progress in my academic discipline or work”, and the others were presented depending on the respondent’s status.
Undergraduates, taught postgraduates, and other students:
- 'The libraries help me distinguish between trustworthy and untrustworthy information.'
- 'The libraries provide me with the training opportunities I need in my work or study.'
Research postgraduates, and academic staff:
- 'The libraries help me stay up-to-date with developments in my field(s) or interest and scholarly communications.'
- 'The libraries enable me to be more efficient in my academic pursuits or work.'
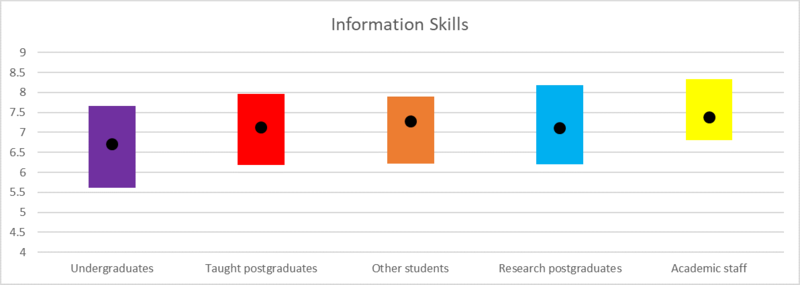
Figure 9: Information skills
| The lowest level I find acceptable is... | The level I ideally want is... | I feel the level currently is... | |
|---|---|---|---|
| Undergraduates | 5.62 | 7.66 | 6.71 |
| Postgraduates | 6.19 | 7.97 | 7.13 |
| Other students | 6.21 | 7.89 | 7.28 |
| Research postgraduates | 6.20 | 8.18 | 7.10 |
| Academic staff | 6.80 | 8.33 | 7.37 |
Strategic programmes
We has six Oxford-specific questions, based on the Strategy 2022–2027 Programmes. We asked all respondents 3 of them at random.
Opening hours
Library opening hours have been an issue for over 10 years. This is often raised in free-text comments, and since 2016 we have asked explicitly about this issue.
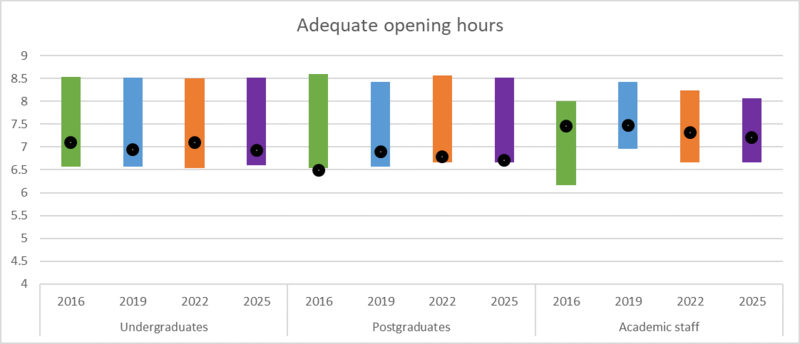
Figure 10: Adequate opening hours
| Year | The lowest level I find acceptable... | The level I ideally want is... | I feel the level currently is... | |
|---|---|---|---|---|
| Undergraduates | 2016 | 6.57 | 8.53 | 7.10 |
| 2019 | 6.57 | 8.51 | 6.94 | |
| 2022 | 6.54 | 8.50 | 7.10 | |
| 2025 | 6.60 | 8.52 | 6.92 | |
| Postgraduates | 2016 | 6.53 | 8.59 | 6.49 |
| 2019 | 6.57 | 8.43 | 6.90 | |
| 2022 | 6.66 | 8.57 | 6.79 | |
| 2025 | 6.66 | 8.51 | 6.71 | |
| Academic staff | 2016 | 6.17 | 8.0 | 7.46 |
| 2019 | 6.96 | 8.42 | 7.48 | |
| 2022 | 6.66 | 8.23 | 7.31 | |
| 2025 | 6.67 | 8.07 | 7.20 |
For all three groups, our current performance level has decreased from the 2019 survey. For undergraduates it has reversed the increases from 2019 and is now at the lowest ever level (6.92). We are performing poorly, as our current level is close to the minimum acceptable level.
We are performing even worse in this area for postgraduates, as our current level (6.71) is only 0.05 points above the minimum acceptable level (6.66). This is a significant drop in performance from the previous two surveys.
For academic staff our current performance is also the lowest ever (7.20), but it is much closer to the ideal level than the student groups.
Unified borrowing policy
This issue emerged from the 2016 survey. We addressed it in the 2017–2022 Strategy, with full implementation continuing in the 2022–2027 Strategy (as it was dependent on Alma). We have therefore asked this question since 2019.

Figure 11: Consistency about what can be borrowed and for how long across all libraries
| Year | The lowest level I find acceptable is... | The level I ideally want is... | I feel the level currently is... | |
|---|---|---|---|---|
| Undergraduates | 2019 | 5.16 | 7.49 | 6.04 |
| 2022 | 5.36 | 7.46 | 6.21 | |
| 2025 | 5.43 | 7.42 | 6.41 | |
| Postgraduates | 2019 | 5.73 | 7.91 | 5.99 |
| 2022 | 5.74 | 7.79 | 6.39 | |
| 2025 | 5.82 | 7.72 | 6.46 | |
| Academic staff | 2019 | 4.68 | 6.79 | 5.62 |
| 2022 | 4.9 | 6.28 | 5.17 | |
| 2025 | 5.41 | 6.82 | 6.19 |
Our current performance level is now a half-point higher than 2019 for all three groups. This shows the impact of the Unified Lending Policy.
However, the absolute level is still lower than our general performance. From the free-text comments, residual dissatisfaction, particularly from postgraduates, is due to the collegiate system, where students do not have borrowing rights (or even access rights, in most cases) for colleges other than their own.
Focus on user experience
“We will listen to our readers and focus on their experience of using the library service” is the first of the guiding principles of the 2022–2027 Strategy. Therefore, we have asked this question in 2025 as a baseline measurement.

Figure 12: 'A library service that listens to its users and focusses on their experiences'
| Year | The lowest level I find acceptable is... | The level I ideally want is... | I feel the level currently is... | |
|---|---|---|---|---|
| Undergraduates | 2022 | 6.01 | 8.06 | 7.10 |
| 2025 | 5.91 | 7.84 | 7.12 | |
| Postgraduates | 2022 | 6.35 | 8.24 | 7.42 |
| 2025 | 6.10 | 7.90 | 7.16 | |
| Academic staff | 2022 | 7.00 | 8.22 | 7.85 |
| 2025 | 6.28 | 8.07 | 7.28 |
The results show that we were performing well in this area. However, our current performance has not improved since 2022: for undergraduates it is the same, and for postgraduates and academic staff it has decreased. Interestingly, all three zones of tolerance have also dropped.
A number of the most pressing issues for students are being addressed through the 2022–2027 Strategy, and solutions are in the process of being implemented. Therefore, respondents will not yet have felt the benefit of changes such as extending borrowing from the CSF, or improved comfort in the reading rooms, so this result is not unexpected.
Sense of belonging
This issue emerged from the 2022 survey, and was incorporated into the updated 2022–2027 Strategy. The 2025 survey is the first time we have asked this question.

Figure 13: 'A place I feel I belong'
| Year | The lowest level I find acceptable is... | The level I ideally want is... | I feel the level currently is... | |
|---|---|---|---|---|
| Undergraduates | 2025 | 5.79 | 7.94 | 7.23 |
| Postgraduates | 2025 | 5.95 | 8.01 | 7.11 |
| Academic staff | 2025 | 5.98 | 7.82 | 7.34 |
We are performing well across all three groups, with postgraduates the least satisfied with our current provision.
Academic transition
Support for academic transition is part of the 2022–2027 Strategy. We asked a specific question in this 2025 survey for the first time.

Figure 14: 'Library induction that supported my academic transition'
| Year | The lowest level I find acceptable is... | The level I ideally want is... | I feel the level currently is... | |
|---|---|---|---|---|
| Undergraduates | 2025 | 5.37 | 7.47 | 6.70 |
| Postgraduates | 2025 | 5.76 | 7.72 | 6.90 |
| Academic staff | 2025 | 5.78 | 7.16 | 6.68 |
We are performing very well across all three groups. Postgraduates are the least satisfied with our current provision, as they have a slightly higher ideal level.
Wellbeing
Spaces and services to support reader wellbeing are part of the 2022–2027 Strategy. We asked a specific question in this 2025 survey, and also gathered information about use.

Figure 15: 'Spaces, activities and events that support my wellbeing'
| Year | The lowest level I find acceptable is... | The level I ideally want is... | I feel the level currently is... | |
|---|---|---|---|---|
| Undergraduates | 2025 | 4.47 | 6.77 | 6.30 |
| Postgraduates | 2025 | 4.92 | 7.01 | 6.45 |
| Academic staff | 2025 | 4.54 | 6.12 | 6.41 |
This question had the lowest desired level of provision and the lowest minimum level of provision from all three groups across all the Reader Survey questions. We are performing extremely well, being very close to the ideal level for both undergraduates and postgraduates. We are over-performing from the viewpoint of academic staff.
This does not distinguish college and Bodleian Libraries provision, and is in the context of the experimental ‘gold standard’ provision at the RSL, which is currently not funded to continue past July 2025.
For the first time we also asked about engagement with the wellbeing offer: “In this current academic year, how often have you used a library wellbeing space, materials, activity or event?”
The results by respondent group are in the below table (Table 17). Thirty-two percent (1,438) had engaged with library wellbeing space, materials, activities or events (for students this will include college library provision).
| Daily | A few times a week | Weekly | Monthly | Termly | Occasionally | Never | |
|---|---|---|---|---|---|---|---|
| Undergraduates | 13 | 32 | 77 | 124 | 88 | 422 | 1454 |
| Taught postgraduates | 5 | 30 | 21 | 36 | 36 | 142 | 488 |
| Research postgraduates | 6 | 15 | 19 | 32 | 39 | 160 | 653 |
| Other student | 5 | 4 | 4 | 5 | 25 | 122 | |
| Academic | 0 | 2 | 4 | 7 | 4 | 26 | 182 |
| Staff | 0 | 0 | 1 | 2 | 5 | 13 | 54 |
| Bodleian Reader card holder | 2 | 5 | 6 | 6 | 3 | 22 | 126 |
| Total | 26 | 79 | 132 | 211 | 180 | 810 | 3079 |
Thirty-three percent of students had engaged with library wellbeing provision in the 2024-25 academic year to date. This can be seen in the graph below (Figure 16).
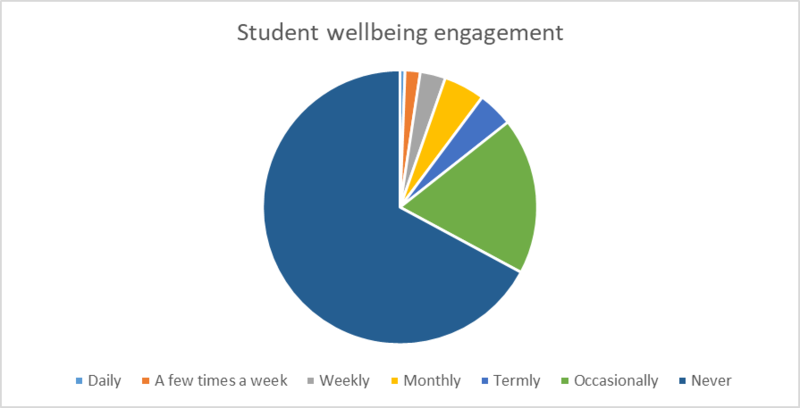
Figure 16: Student wellbeing engagement
Diversity of collections
Improving the diversity of our collections is part of the 2022–2027 Strategy. We asked about this in 2025 for first time as one of the Collections questions.

Figure 17: 'Diversity of materials reflecting the full range of scholarship in my subject'
| Year | The lowest level I find acceptable is... | The level I ideally want is... | I feel the level currently is... | |
|---|---|---|---|---|
| Undergraduates | 2025 | 6.53 | 8.54 | 7.34 |
| Postgraduates | 2025 | 6.90 | 8.60 | 7.43 |
| Academic staff | 2025 | 7.20 | 8.78 | 7.44 |
All three groups have similar ideal levels of provision, but they vary in the lowest level they find acceptable. Although undergraduates rate our current level of provision as lowest (7.3), this is just below the middle of the zone of tolerance and so we are performing best for them. Postgraduates and academic staff rate our current provision equally (7.4), but we are close to the lowest level for postgraduates and very close for academic staff.
Group study room use
Improving spaces for collaborative and hybrid working is part of the 2022–2027 Strategy. Space for group learning and group study is a standard ‘physical library spaces’ question, and so has been asked in each survey.
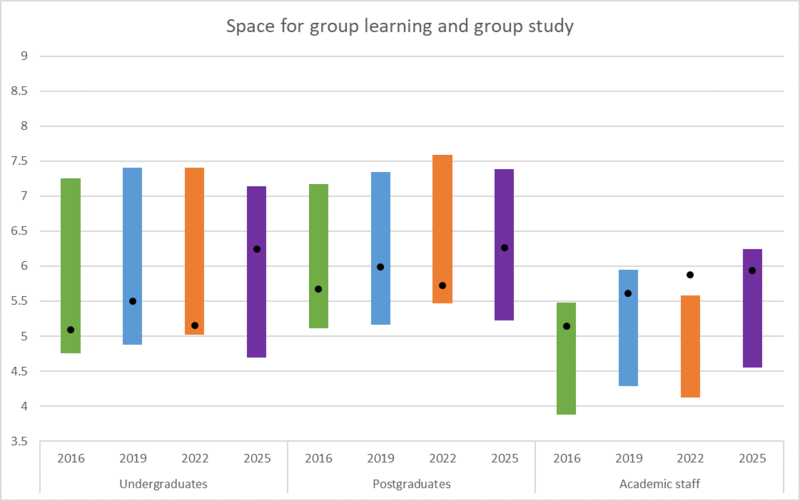
Figure 18: Space for group learning and group study
| Year | The lowest level I find acceptable is... | The level I ideally want is... | I feel the level currently is... | |
|---|---|---|---|---|
| Undergraduates | 2016 | 4.76 | 7.25 | 5.09 |
| 2019 | 4.88 | 7.40 | 5.50 | |
| 2022 | 5.02 | 7.40 | 5.15 | |
| 2025 | 4.69 | 7.14 | 6.24 | |
| Postgraduates | 2016 | 5.11 | 7.17 | 5.67 |
| 2019 | 5.16 | 7.34 | 5.99 | |
| 2022 | 5.47 | 7.59 | 5.72 | |
| 2025 | 5.22 | 7.38 | 6.26 | |
| Academic staff | 2016 | 3.88 | 5.48 | 5.14 |
| 2019 | 4.29 | 5.95 | 5.61 | |
| 2022 | 4.12 | 5.58 | 5.88 | |
| 2025 | 4.55 | 6.24 | 5.94 |
Our current provision has hugely increased for undergraduates since 2022 (from 5.15 to 6.24), and for the first time it is now closer to the ideal level than the minimum level. Postgraduates also reported a significant improvement, and is now in the middle of the zone of tolerance. Interestingly, the rating from academic staff has increased slightly (from 5.88 to 5.94), but the zone of tolerance has moved up, and so we are now within the zone, a similar distance from the ideal level as in 2016 and 2019.
For the first time we also asked about engagement with the group study room offer: “In this current academic year, how often have you used a library group study room?”
The results by respondent group are in the below table. Thirty-eight percent (1,711) had used library group study room (though for university members this may include college library provision).
| Daily | A few times a week | Weekly | Monthly | Termly | Occasionally | Never | |
|---|---|---|---|---|---|---|---|
| Undergraduate | 18 | 79 | 128 | 239 | 106 | 434 | 1206 |
| Taught postgraduate | 9 | 20 | 36 | 62 | 29 | 127 | 465 |
| Research postgraduate | 5 | 20 | 32 | 49 | 37 | 108 | 673 |
| Other student | 2 | 4 | 9 | 7 | 3 | 21 | 119 |
| Academic | 2 | 2 | 6 | 6 | 6 | 24 | 179 |
| Staff | 0 | 1 | 0 | 3 | 4 | 6 | 61 |
| Bodleian Reader card holder | 2 | 3 | 7 | 3 | 3 | 22 | 130 |
| Total | 38 | 129 | 218 | 396 | 188 | 742 | 2833 |
Thirty-nine percent of students had used a library group study room in the 2024–25 academic year to date. This can be seen in the below graph.
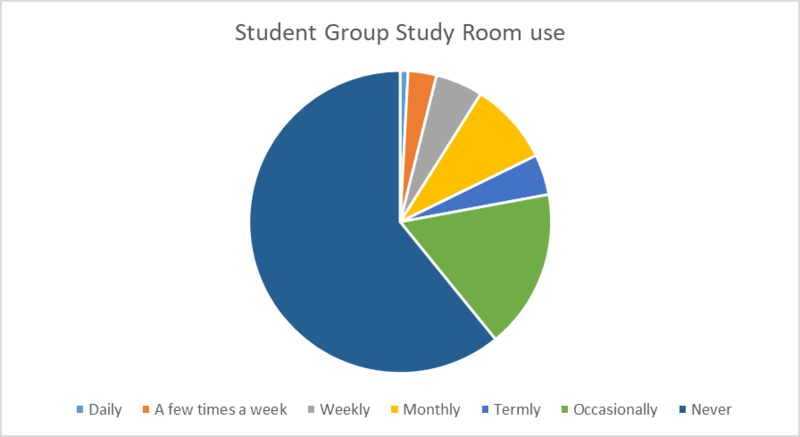
Figure 19: Student group study room use


